No Two Food Manufacturers Are Alike. Your Forecast Shouldn't Be Either.
Most demand planning software asks every customer the same question: what will each SKU sell at each location? For some food and beverage businesses that is roughly the right question. For others it is the wrong one, and tuning the model harder won't rescue a forecast aimed at the wrong target.

The usual debate in demand planning is about methods: exponential smoothing or machine learning, this vendor’s engine or that one. The decisions that matter more come before any method is chosen. What does the business actually need forecast, and at what level of detail? And is the system capable of forecasting that well? Off-the-shelf planning software tends to answer the first question the same way for everyone, and its models often can’t deliver the second even when the answer happens to fit.
The right target depends on how the business makes money
Four food and beverage businesses can sit a few miles apart and need completely different forecasts.
A fresh bakery supplier bakes overnight and delivers each morning. Its product lasts days. The forecast that matters is short-range and fine-grained: each SKU, for each store or route, for each day. Weather, school holidays and local events move demand. A miss shows up within 48 hours as stale bread in a dumpster or an empty shelf.
A beverage brand makes to stock and sells through distributors and retailers. The forecast that matters is each SKU by distributor and channel, weeks ahead, because that is how production, co-packer slots and DC stock are committed. Promotions, new listings and launches with no history drive most of the risk.
An ingredients supplier sells flavors, proteins or dairy powders to a short list of manufacturers under contract. Its customers order in large, irregular lots. A time series of past shipments says little about the next order. What the customer is planning says a lot, so the forecast has to work account by account, using commercial signals.
A manufacturer with long-lead raw materials — cocoa, specialty grains, packaging with 16-week lead times, cheese that must age for a year — has to commit to inputs long before finished goods ship. Forecasting finished products and working backwards through the recipe multiplies the error: a small miss on each of twenty SKUs that share an input becomes a large miss on the input. The forecast that matters is the material itself, at each plant that uses it, far enough ahead to cover its lead time.
| Business | What needs forecasting | Horizon that matters | Cost of a miss |
|---|---|---|---|
| Fresh bakery supplier | SKU × store × day | Days | Waste or empty shelves within 48 hours |
| Beverage brand | SKU × distributor × channel | Weeks to months | Excess stock, missed promotions, co-packer penalties |
| Ingredients supplier | Account-level orders | Contract cycle | A short key account or stock sold at a discount |
| Long-lead materials | The raw material, by plant | The material’s lead time | Months of capital tied up, or a gap that can’t be closed |
Accuracy at the wrong level is a comfort, not a plan. Aggregate accuracy for the beverage brand might look excellent while the distributor-level numbers, the ones production is planned against, are poor. The question isn’t which forecasting method is best. It is which question the business needs its forecast to answer.
Why one model library can’t serve every business
Most advanced planning systems were designed to serve thousands of companies with one product. They ship a fixed library of forecasting methods, the same for every customer, and select one per SKU based on how well it fits the history. Implementation is a configuration project that maps your business onto the vendor’s model of items, locations and periods.
That design has real strengths: workflow, governance and ERP integration. It also sets a limit. Accuracy usually improves a few points over spreadsheets and then flattens out, however much tuning follows. That isn’t the implementation team’s fault. A general-purpose library can only describe your business as well as its best-fitting method does, and once each SKU has that method, there is nowhere further to go. Everything that makes your business different, such as aging profiles, contract calendars, shared lines, or the way one SKU’s promotion pulls volume from its sister product, lives outside the model, in planners’ spreadsheets and heads. The team corrects the forecast by hand every month, and the corrections never teach the model anything.
A forecast that learns your decisions as demand
There is a second, quieter problem. A forecast trained only on history learns your own decisions as if they were customer behavior.
Consider a snack manufacturer whose co-packer loses a line for three weeks in March. To protect its largest account, the business allocates product away from two regional grocers. Their recorded demand falls. Next quarter’s forecast, fitted to that history, predicts lower demand from both. Capacity and materials are planned to the lower number, so when the grocers’ orders return to normal, there isn’t enough product, and the business allocates again. Each cycle, the history looks a little more like the constraint and a little less like the market.
The accuracy report won’t flag any of this. The forecast keeps getting the numbers right, because the numbers are being produced by the company’s own allocations. A model that understands the business has to separate a decision you made from a signal the market sent, and keep the first out of the second.
Where chatbots and agents fit
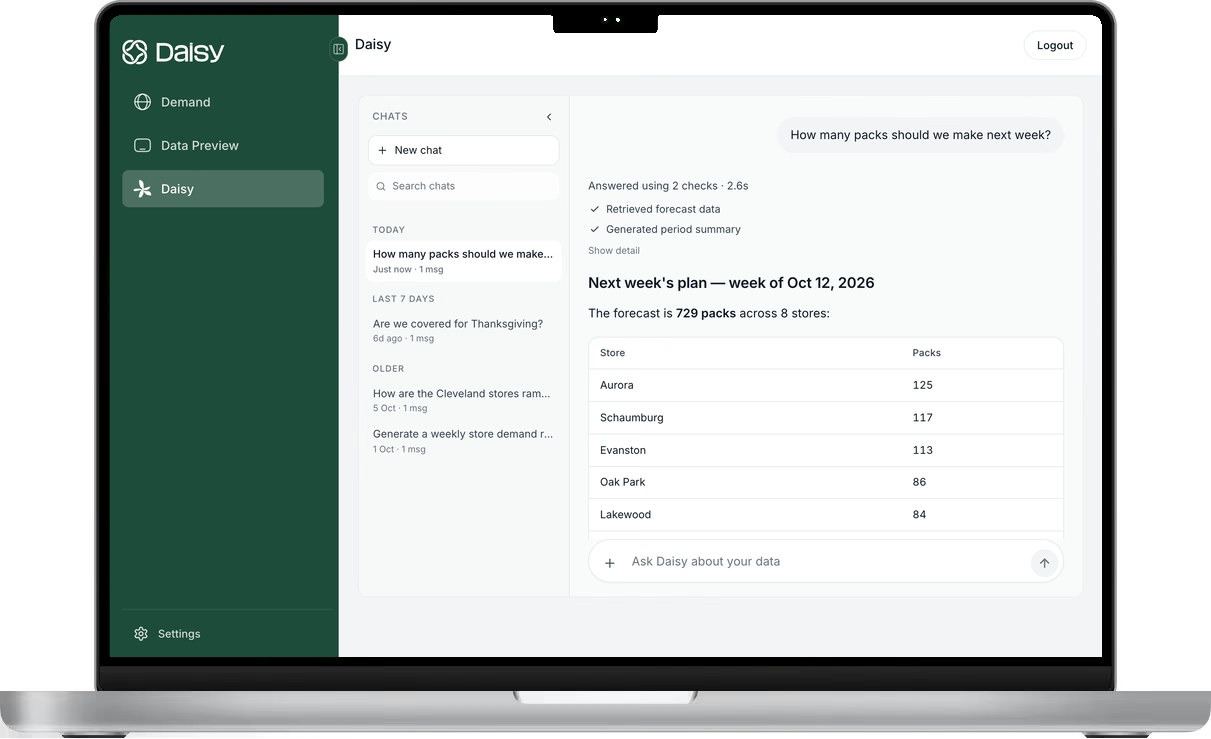
Almost every planning vendor now describes its product as AI-powered. Often that means a chat interface on top of the same forecasting engine, or an agent that runs the existing workflow faster. Both have their uses. Neither changes what the forecast is aimed at or what it understands.
Large language models learn from text. They are useful for querying data and explaining results, but they are the wrong tool for generating demand numbers: they have never seen your plants, your customers or your shelf lives. An agent that reruns the forecast overnight is only as good as the forecasting engine it calls. Speed helps. It doesn’t raise the limit.
What purpose-built means
Purpose-built forecasting starts from the other end. Instead of fitting your business to a template, the model is built around your business. With Daisy, that means:
- A model for each company, trained on its own network of plants, DCs, co-packers, products and customers, rather than a menu of methods shared with everyone else.
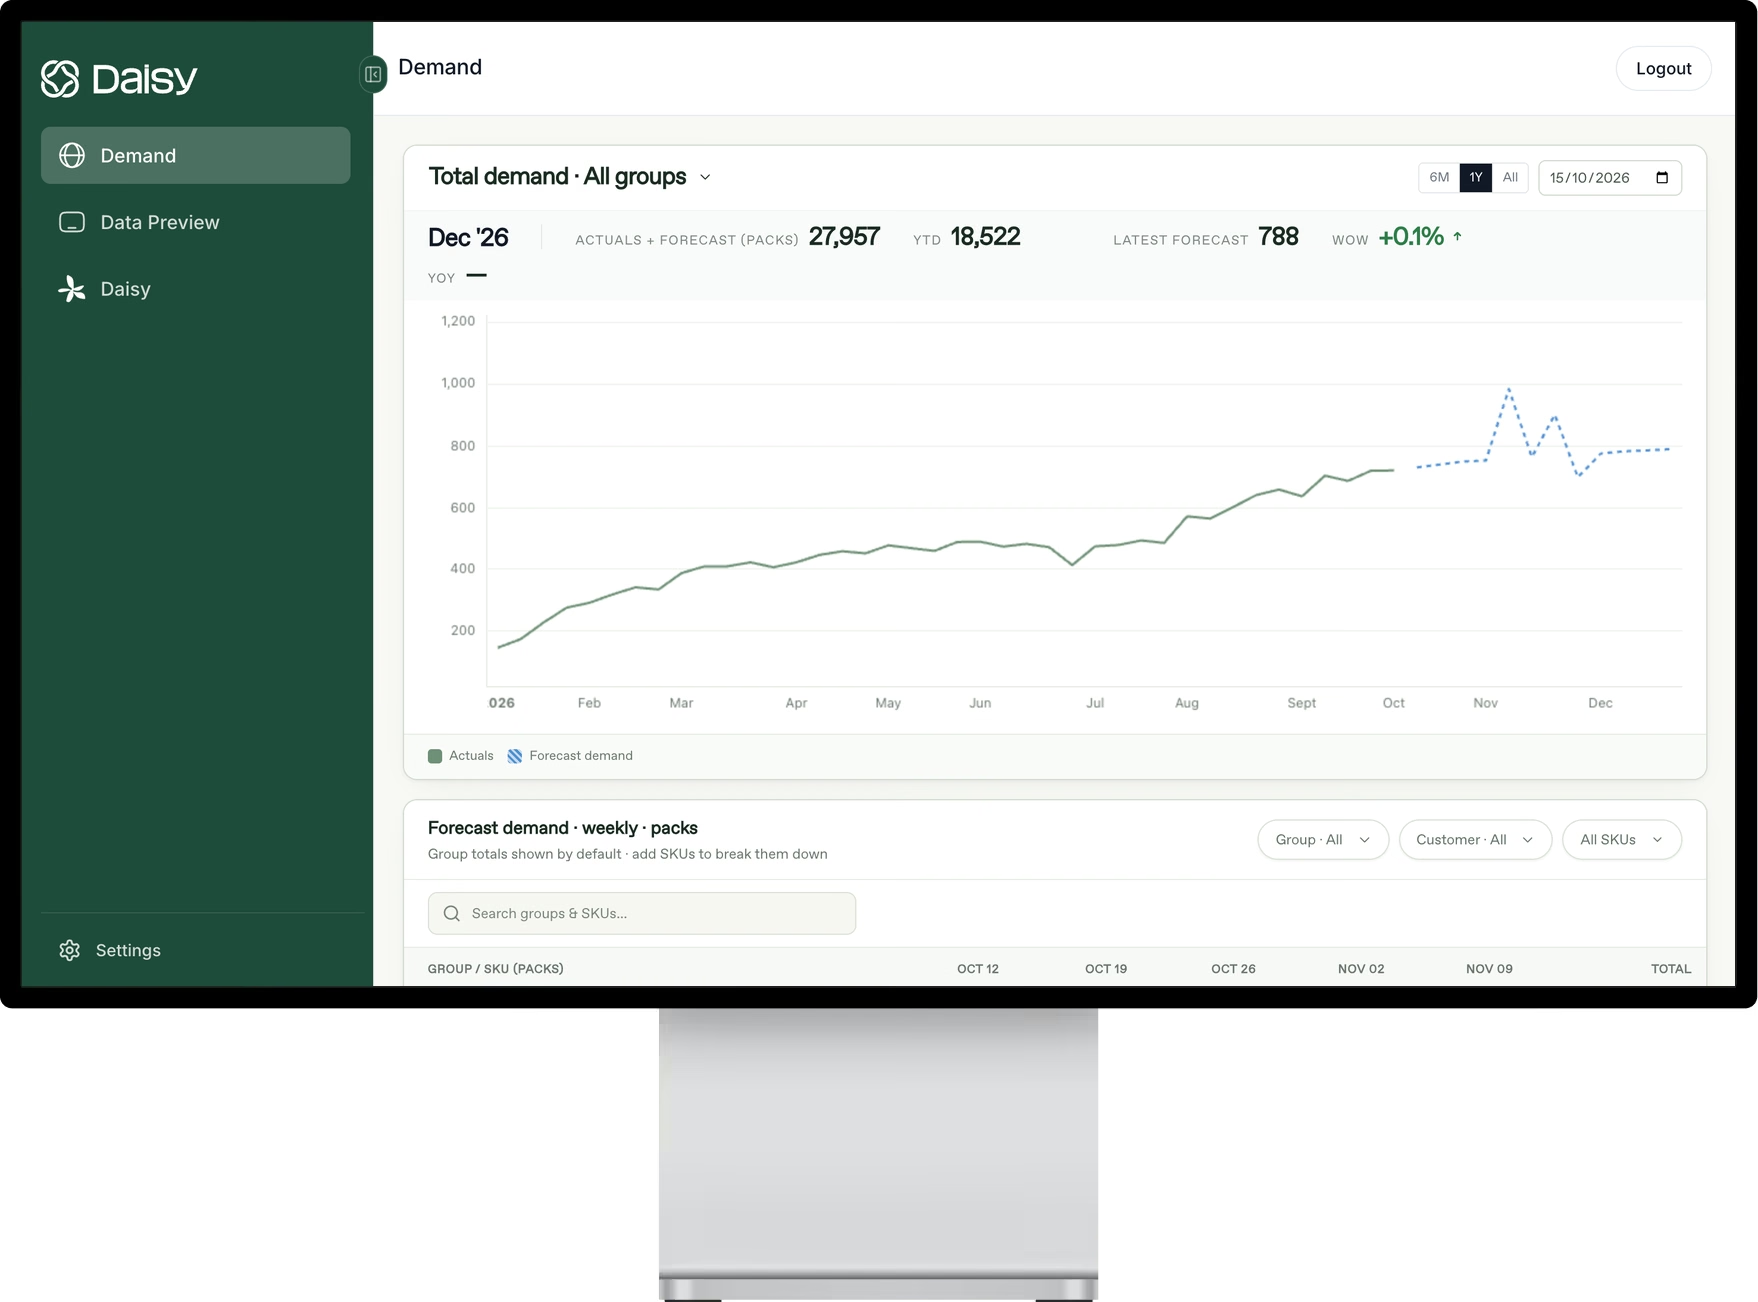
- Forecasts aimed at the decision, typically SKU × location × account, or the material and plant where that is what drives the decision. Accuracy at that level is what gives planners the confidence to act.
- Thousands of external signals, from weather and holidays to category and macroeconomic data, alongside your own history.
- Drivers you can see. Every forecast comes with the reasons behind it, so a planner can tell why a number moved and challenge it.
- No clean-data prerequisite. Daisy works with data as it is, from ERP exports to spreadsheets to customer files, and brings scattered sources together.
- Forecasts for new products and new customers, built from similar items and attributes when there is little or no history to learn from.
The team behind the model
A forecast only changes decisions when the people using it trust it, and trust comes from being able to ask why a number moved and get a real answer quickly. That is why Daisy customers work directly with the engineers who build their models. When the business changes, whether through a new plant, a national account win or a new product line, the model is rebuilt to match by the people who designed it, not through a support ticket.
The relationship starts with evidence rather than promises. A typical pilot runs for 12 weeks against your current forecast, on your own data:
- Weeks 1–2: Daisy takes in sales history, customers, locations and promotions, including whatever lives in spreadsheets, and maps your network.
- Weeks 3–6: the model is built and back-tested against your history and your existing forecast, at the level you plan and purchase.
- Weeks 7–12: Daisy forecasts live alongside your current process, and both are scored on the same actuals.
Kerry Dairy Ireland replaced a spreadsheet-based forecasting process with Daisy. Read the case study.
Questions to ask any forecasting partner
- Will the model be built for our network, or configured from a standard library?
- What exactly will it forecast, and at what level? Is that the level our decisions are made at?
- How will it tell our own decisions, such as allocations, reroutes and stockouts, apart from real changes in demand?
- Will accuracy be measured against our current forecast, on our data, before we commit?
- Who do we call when a forecast looks wrong, and how quickly will they answer?
- What happens when we add a plant, a customer or a product line?
If forecasts keep missing and nobody can say why, look at the target before the tuning. A model aimed at the wrong level, or one that treats your own allocations as demand, will stay wrong however carefully it is tuned.
Photo: Sergey Kotenev on Unsplash.
See Daisy in action.
Ready to implement in 2 weeks
Want to try Daisy?
We’ll be in touch shortly to set up a time.