The S&OP Playbook for Food and Beverage Manufacturers
S&OP, or sales and operations planning, is a monthly decision process that lines up what a business expects to sell with what it can make, store and afford. Sales, operations, supply chain and finance each bring their view, and the cycle ends with one plan that all of them run. The horizon usually stretches 18 to 24 months, with week-level detail only for the nearest few.
Four things to know up front:
- The cycle has five stages, running from a review of the product portfolio to an executive decision meeting.
- It is a discipline before it is a tool. Software can make it quicker and better informed. It can’t create the discipline.
- Demand planning feeds it. S&OP is where the demand forecast meets supply, inventory and money.
- Integrated business planning (IBP) is the same discipline with finance and strategy more involved and a longer horizon.
Consider the week before the executive meeting at a snack manufacturer. The demand planner has three versions of July: her statistical baseline, a sales number that assumes a new club-store listing, and an operations number trimmed for a fryer rebuild. Finance wants the total to match the budget the board approved. On Thursday the leadership team spends forty minutes on why the three disagree and settles on roughly the average. Nobody records why sales was high or why operations was low. In August, everyone is surprised in a different direction.
The meeting is the visible part of S&OP. This playbook covers the rest: how the cycle should run, why it struggles once a network outgrows its planning team, and how to make each month end in decisions rather than a negotiated number.
Where S&OP sits among the other planning terms
| Term | What it covers | Relationship to S&OP |
|---|---|---|
| Demand planning | Forecasting what customers will buy, including promotions, launches and listing changes | Supplies the unconstrained demand plan |
| Supply planning | Working out what plants, co-packers and suppliers can deliver | Supplies the constraints the plan is tested against |
| S&OP | The monthly cross-functional forum that agrees one operating plan | Where the trade-offs are decided |
| IBP | S&OP with portfolio, strategy and finance decisions brought inside the cycle | Same steps, wider remit, longer view |
| Production schedule | Which line makes what, week by week or day by day | Downstream: it turns S&OP volumes into build orders |
The five stages of the monthly cycle
Most companies run the cycle in the three weeks after the books close, so every stage works from real actuals. Smaller businesses often merge stages, which is fine as long as each question still gets asked.
| Stage | Typical timing | Led by | What comes out |
|---|---|---|---|
| 1. Portfolio review | Working days 3–5 | Marketing or product | Launches, reformulations and delists, each with a volume assumption and a date |
| 2. Demand review | Days 5–8 | Demand planning, with sales | The unconstrained demand plan by product family, channel and major customer |
| 3. Supply review | Days 8–11 | Operations and supply planning | What can be made, packed and stored, the gaps, and what closing each gap would cost |
| 4. Reconciliation | Days 11–13 | The S&OP process owner, with finance | A shortlist of decisions, each with options, prices and a recommendation |
| 5. Executive meeting | Days 14–15 | CEO or general manager | Decisions with an owner, a cost and a review date |
Stages one to four are preparation. Their product is a short agenda of decisions, each with options and prices attached. When preparation is weak, executives end up redoing the demand and supply reviews themselves, and the decision waits another month.
The knowledge that never reaches the system
The most valuable input to a demand review usually isn’t the statistical forecast. It is what people have heard: a distributor is consolidating warehouses in the spring, a retailer’s category manager has hinted at a range cut, a filler on line two needs replacing before peak, a competitor is struggling to get cans. None of it is in the ERP. It travels by email and hallway conversation, and it changes the plan.
There is good evidence that it helps. Researchers who examined more than 60,000 forecasts from four supply chain companies found that planners’ adjustments to the statistical forecast improved accuracy on average at three of them. Big adjustments tended to pay off. Small tweaks often made things worse, and increases went wrong much more often than cuts, a pattern the authors put down to optimism (Fildes, Goodwin, Lawrence and Nikolopoulos, 2009).
So judgment brings real information and predictable bias, and in most companies nobody can separate the two, because a judgment call leaves nothing behind except an edited cell. The remedy is an assumption log. Every material change to the baseline gets a line: what changed, who owns it, the volume effect, the evidence, and the date to check it. After a couple of quarters, the log shows whose instincts are worth following and where optimism creeps in.
Why S&OP struggles as networks grow
These problems are most visible in companies with many SKUs, several plants or co-packers, and lean planning teams. They are not signs of a team doing S&OP badly. They are built into the way the process works.
One number hides two stories. The cycle is designed to end with a single figure. If sales argues for 40,000 cases and operations for 31,000, the room tends to land near 35,000. Yet each side had a reason: sales had a customer commitment, operations had a supplier warning. The compromise honors neither, and once the meeting ends, the reasons are gone.
Decisions are monthly, the market is not. A plan signed off in mid-May is carried out in late June, in conditions nobody in the room could see. A retailer resets its shelves, a co-packer slips, an early heat wave doubles demand for cold drinks. Companies cope with off-cycle calls, which works, and which also shows that a monthly rhythm no longer fits the business.
The executive meeting sees one future. Reconciliation is meant to offer choices. Usually it offers one plan and perhaps a backup, because building another version in a spreadsheet takes days the team doesn’t have. Leaders end up debating the plan on the table, and a decision can’t be better than the handful of futures someone found time to model.
Today’s decisions become tomorrow’s demand history. This is the least discussed problem and the most damaging. Choices made in S&OP are stored in the transaction data as if customers had made them. Short a customer during an allocation and their history shows lower demand. Move volume from one co-packer to another and the history shows demand migrating between sites. Ship late because a line was down and the order appears in the wrong month. The next baseline is trained on all of it. When supply is short, recorded sales understate real demand (Nahmias, 1994), and when buyers start ordering defensively, order history stops describing demand altogether (Lee, Padmanabhan and Whang, 1997).
That is how a forecast can score well while a business holds itself back. It predicted the outcome accurately because the plan caused the outcome.
Food and beverage adds pressure of its own. Some supply arrives whether it is wanted or not: milk comes in every day, and a tomato harvest has to be packed in a few weeks. Code dates limit how far ahead many products can be built, so a spike in demand becomes a question about lines, labor and cleaning schedules rather than stock.
Making the cycle end in decisions
Most of these problems share a root: reconciliation happens in the days before the meeting, done by people, in tools that hold one version of the plan at a time. Whatever nobody had time to model gets settled by debate. The practices below help with any tools, and they help most when the team can model many versions quickly.
Record judgment as assumptions. A customer’s new DC, a supplier’s warning or a planned price rise belongs in the plan as a named assumption with an owner and a date, so everyone downstream can see it and someone can check it later.
Model the obvious questions in advance. Executives ask the same kinds of question every month. What if the promotion runs 30% hot? What if the co-packer outage lasts two weeks longer? Bring those answers to the room, priced in cash and service, and the meeting becomes a choice between options. A good outcome reads like this: build four extra weeks of cover on the ten most exposed SKUs, accept 94% service on slow movers, and revisit on the 12th once the co-packer confirms its restart date.
Score the rejected options too. At the end of each quarter, compare what actually happened with the plan you picked and with the alternatives you passed on. A few quarters of that comparison reveals whether the leadership team tends to under-reach or over-reach, something no accuracy report can show.
None of this demands new software. A manufacturer with a modest catalog, one plant and steady demand can run an excellent cycle on spreadsheets, and should put its energy into meeting discipline. The monthly rhythm and the executive forum remain useful at any scale. The difference better tools make is in how much modeling happens before the meeting, so the meeting itself can be spent deciding.
What to look for in S&OP technology
- A model of your actual network. Many planning suites fit the same set of statistical methods to every company’s history. Plants, co-packers, lanes, shelf lives and substitutions are captured loosely or not at all, which limits what any scenario can tell you.
- Scenarios that take minutes, not days. When a scenario costs a day, the team builds two. When it costs minutes, most of the executive team’s questions are answered before they are asked.
- A distinction between customer behavior and your own decisions. Without it, an allocation looks the same as a lost account, and the next cycle repeats the mistake.
- Somewhere for judgment to live. Planner knowledge should enter the plan as an input with its reasoning attached, so its effect can be measured later.
Is your S&OP process working?
These questions tend to find the real bottleneck faster than a maturity model:
- Before the last executive meeting, how many scenarios were priced? One means the meeting was a negotiation.
- Could a colleague find out next quarter why a planner overrode this month’s statistical forecast?
- What would the plan you rejected last quarter have delivered?
- How much of last year’s demand history was really your own allocations, shortages and reroutes?
- When an executive asks a new question in the meeting, how long does the answer take? If it usually waits for next month’s cycle, the calendar is running the business.
- Does the cycle finish with a number, or with decisions that have owners, costs and review dates?
How Daisy helps
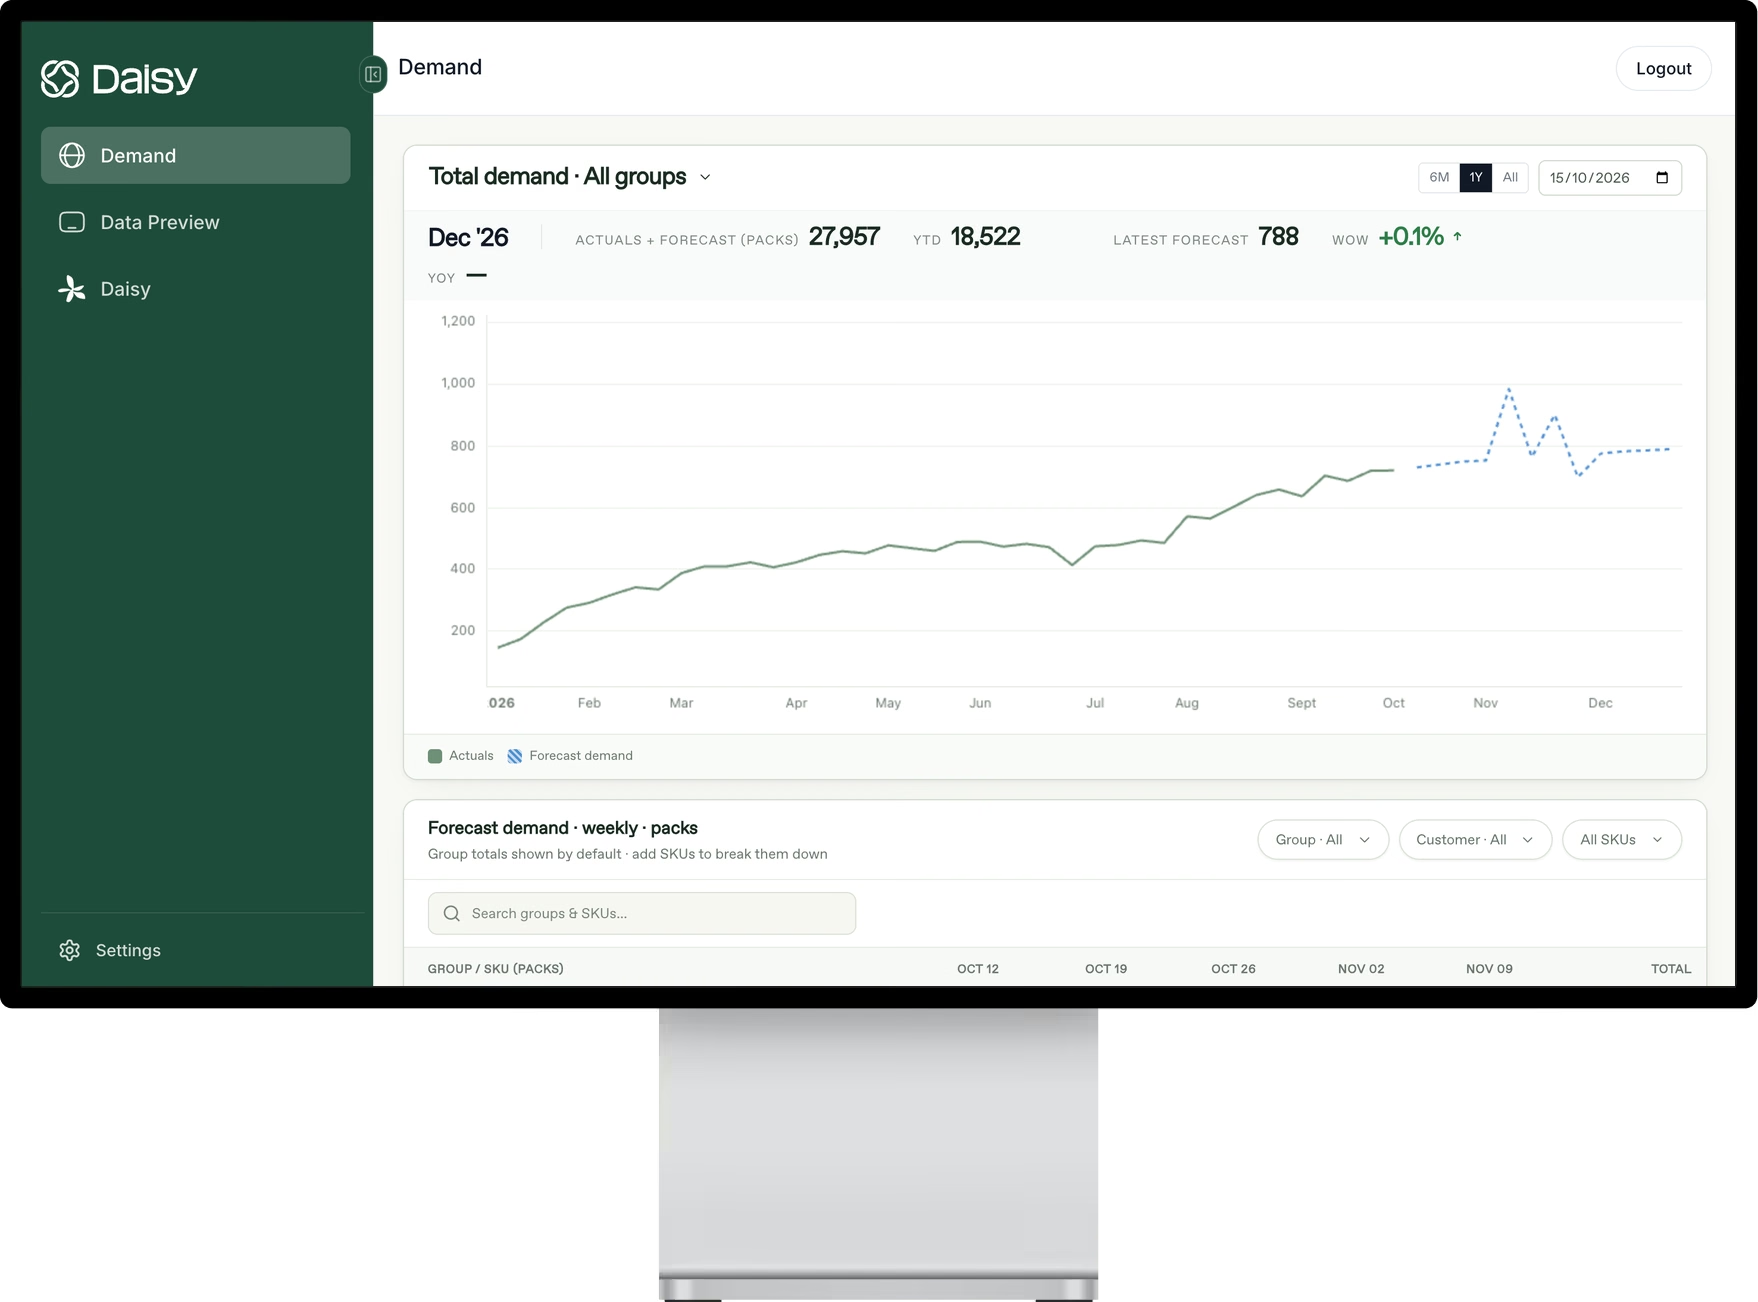
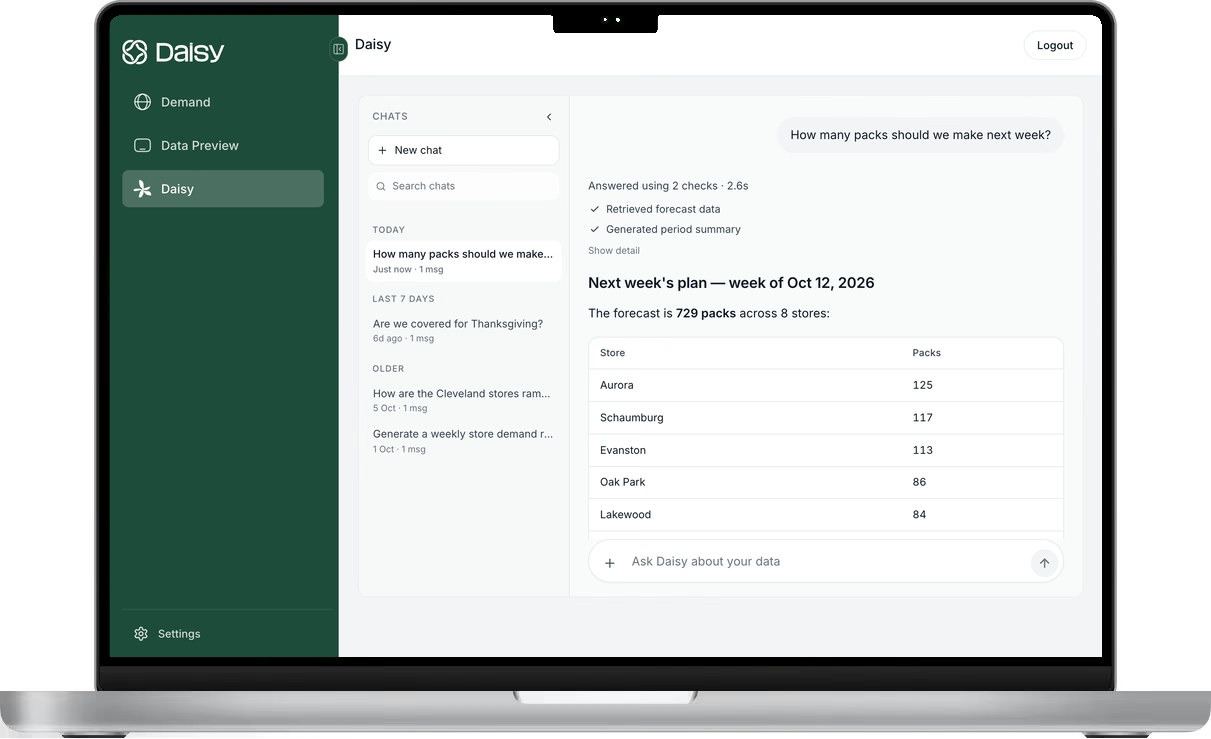
The demand review starts from a baseline, and the baseline sets the ceiling on everything after it. Daisy gives the S&OP team a forecast at SKU × location × account, produced by a model trained on that company’s own network and on thousands of external signals, with the drivers behind each number laid out. The demand review can then argue about assumptions instead of arithmetic.
Daisy is built to support planners rather than replace them. It forecasts new products and new customers with little or no history, which is where the portfolio review is usually weakest, and it runs live against your current forecast before you commit. Kerry Dairy Ireland uses Daisy for its milk supply forecasts and plans to bring Daisy into its full S&OP cycle. Read the case study.
Frequently asked questions
What is the difference between S&OP and IBP?
IBP widens S&OP so that strategy, portfolio and financial decisions are made inside the cycle, usually over a longer horizon. The monthly steps look much the same. The practical test is whether finance helps build the plan or just receives it.
Where does demand planning fit in S&OP?
Demand planning creates the starting forecast for the demand review, before any supply limits are applied. S&OP then tests that forecast against supply, inventory and money, and decides what the business will do.
Which metrics should an S&OP process track?
Forecast accuracy and bias where decisions are made, case fill rate and on-time, in-full delivery, inventory against target, and how closely production followed the agreed plan. Track the process too: the share of decisions the executive meeting actually takes rather than postpones.
Is monthly often enough?
For the executive decision meeting, usually yes, because it follows the financial close. Many food and beverage companies add a short weekly demand and capacity check underneath it, particularly for fresh and seasonal lines.
Who should run S&OP?
A process owner who doesn't own either the demand plan or the supply plan, and an executive chair with the authority to commit capacity and cash.
How quickly can S&OP be set up?
A working cycle usually takes one or two quarters. Getting to the point where leaders decide in the room rather than taking issues away is slower, because it rests on confidence in the numbers.
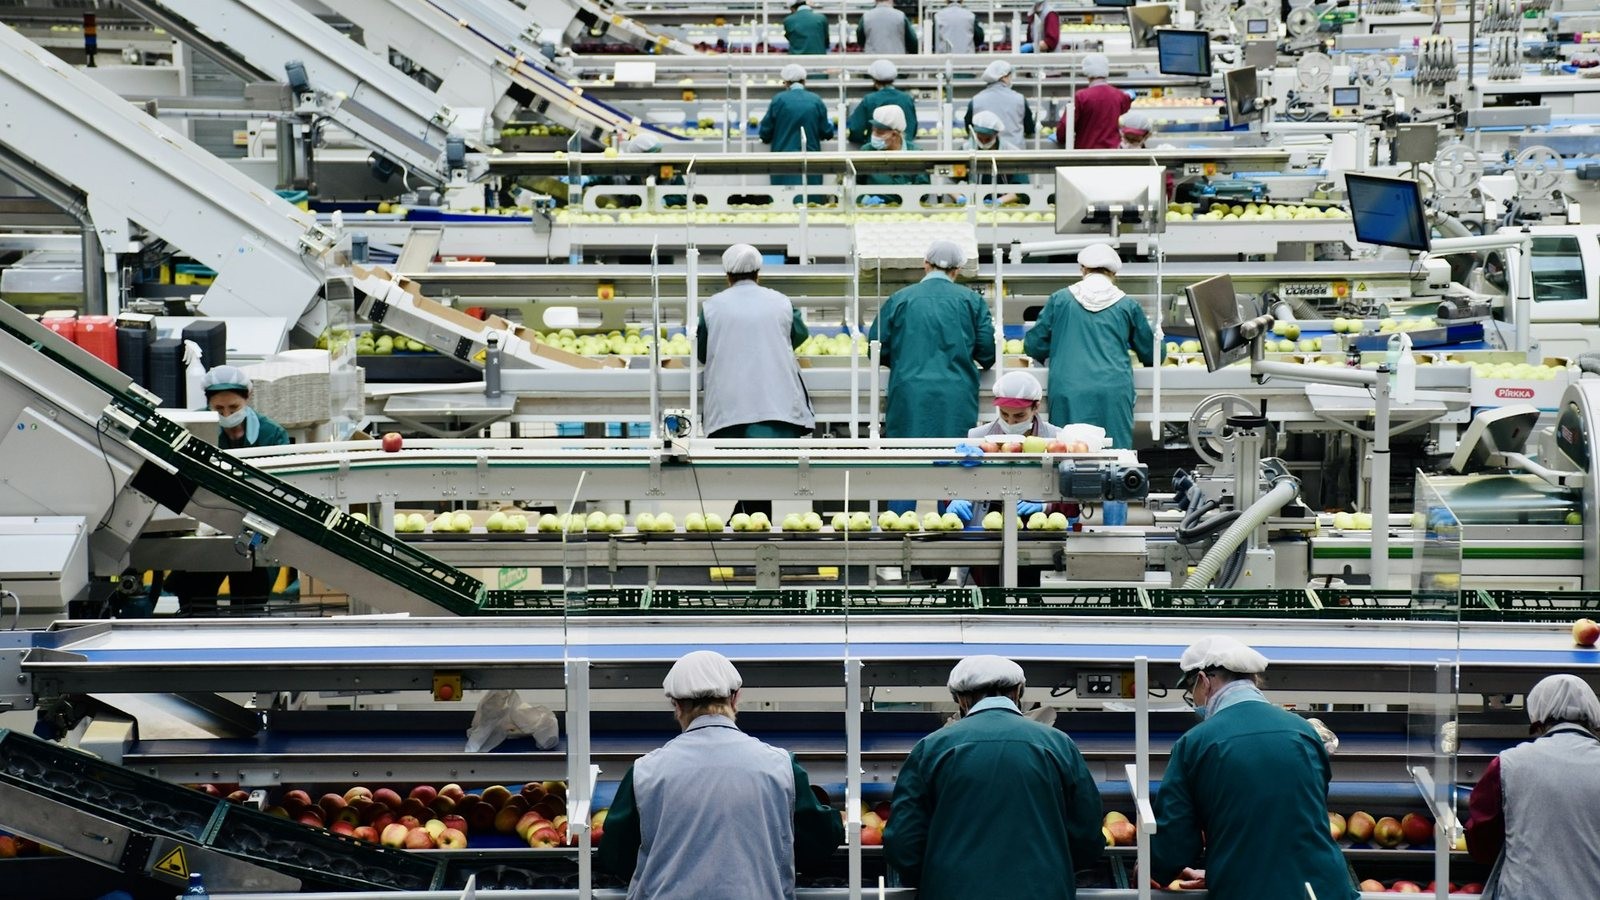
Photo: Arno Senoner on Unsplash.
See Daisy in action.
Ready to implement in 2 weeks
Want to try Daisy?
We’ll be in touch shortly to set up a time.